
Crypto
What Is the Bitcoin Market Cycle and Why It Matters?
Bitcoin’s price often changes quickly, but these movements usually follow a specific pattern. As of February 24, 2026, Bitcoin trades at approximately $67,100 USD. This represents a significant correction year-to-date, driven by institutional de-risking and ETF outflows. These price changes are part of the Bitcoin market cycle, which repeats roughly every four years. Understanding these cycles helps investors identify market trends and make informed decisions.
Understanding Bitcoin Market Cycles
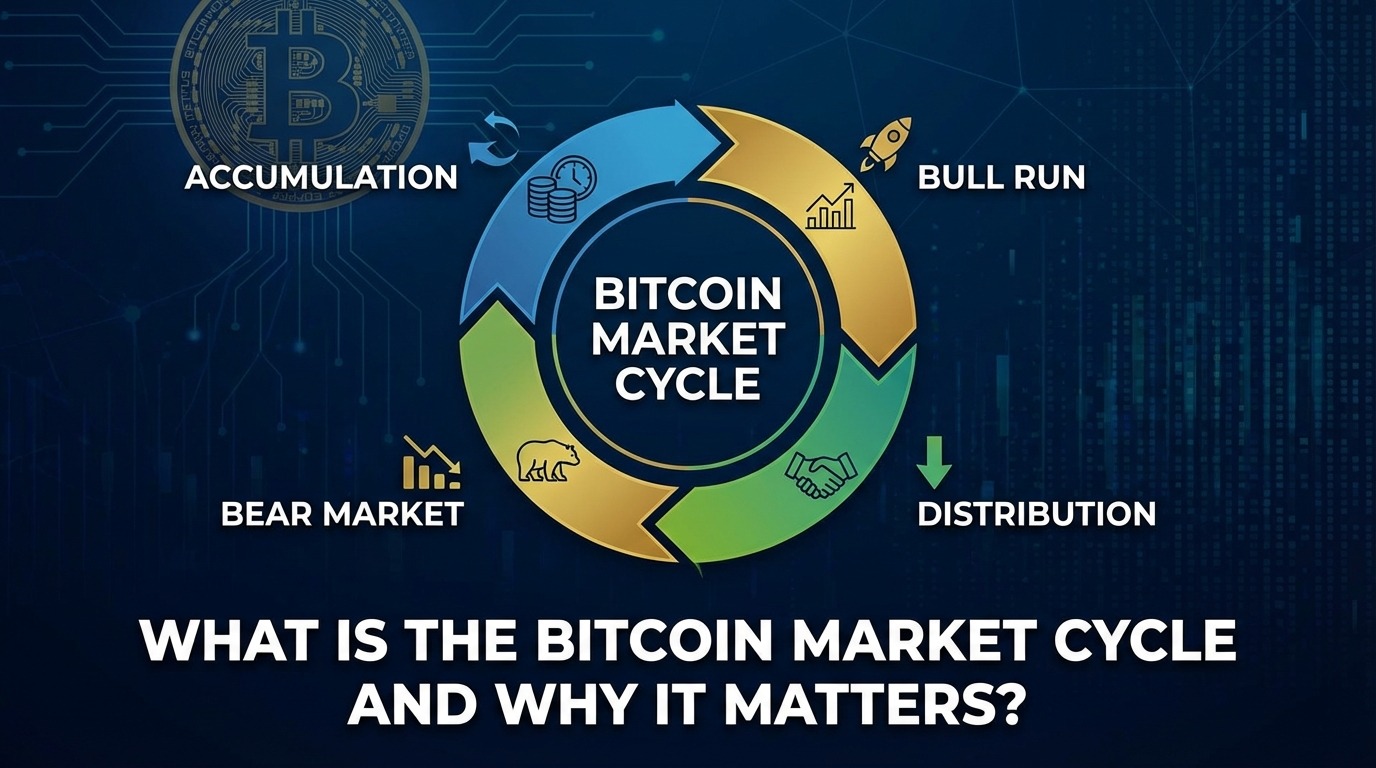
Bitcoin market cycles are four-year patterns driven by “halving” events. These cycles consist of four phases: accumulation, markup, distribution, and markdown, which move the price from low points to high peaks.
From late 2022 to late 2025, Bitcoin’s price rose from $15,500 to an all-time high of over $126,000. This is an example of a full market cycle. These cycles are not random. They are controlled by Bitcoin halvings, which happen every 210,000 blocks (approximately every four years). This event reduces the supply of new Bitcoin entering the market.
What Are Bitcoin Market Cycles? Definition and Core Phases
You can view the Bitcoin cycle as a loop with four distinct stages.
- Accumulation Phase: Prices are low after a market drop. Investors and institutions actively participate in the BTC USDT market to buy Bitcoin at a lower price. An example is the 2022-2023 period, where Bitcoin traded between $16,000 and $30,000 with little volatility.
- Markup (Bull Run) Phase: Demand increases and prices rise quickly. This often happens after a halving event. After the 2024 halving, the market saw this phase as the price reached a new high of $126,300 in October 2025.
- Distribution Phase: The price hits a peak. Long-term holders begin to sell their assets. Data often shows that large holders (whales) move coins to exchanges during this time. This occurred in late 2025 as Smart Money began to exit.
- Markdown (Bear) Phase: Prices decrease as selling continues. This is the current phase in early 2026, where prices have corrected ~47% from the peak to the $60,000s.
These phases are connected to halvings. The April 2024 halving reduced mining rewards from 6.25 to 3.125 BTC per block, which lowered the daily supply.
Key Takeaway: You can track these phases using tools like the MVRV Z-Score. Currently, the score suggests market fear is high, often indicating potential capitulation rather than stability.
Historical Bitcoin Cycles: Patterns from Past Halvings
Historical data shows that each halving event starts a new cycle. However, the percentage of growth tends to decrease as the market gets larger.
Below is a comparison of past cycles:
| Halving Date | Accumulation Low | Peak Price | Cycle Gain | Duration to Peak |
| Nov 2012 | ~$12 | $1,100 | 9,000% | 13 months |
| Jul 2016 | ~$650 | $20,000 | 3,000% | 17 months |
| May 2020 | ~$4,000 | $69,000 | 1,600% | 18 months |
| Apr 2024 | ~$42,000 (pre) | $126,300 | ~200% | 18 months (Oct 2025) |
- 2012 Cycle: This was the first major cycle and established the four-year pattern.
- 2016 Cycle: Institutional interest began to grow, driving the price to $20,000.
- 2020 Cycle: Economic factors and the approval of futures ETFs helped the price reach $69,000.
- 2024 (Current): Spot ETFs drove the price to $126,000, but 2026 has seen outflows of over $4.5 billion year-to-date, contributing to the current correction to $67,100.
Insight: While the percentage gain is lower than in the early days, the absolute value of the market has grown significantly.
Why Bitcoin Market Cycles Matter for Investors
Bitcoin cycles help investors predict price trends based on supply changes. This knowledge allows investors to buy when prices are stable and sell during periods of high demand.
Understanding the cycle gives you a clearer perspective. With Bitcoin at $67,100 and negative funding rates, the market appears to be in a Markdown or Repair phase. This is often viewed as a period of volatility where the market digests previous excesses.
Predicting Bitcoin Price Movements with Cycle Analysis
Investors use data to analyze the cycle. Here are key metrics used in early 2026:
- Puell Multiple: This measures miner revenue compared to historical averages. It is currently low (below 1.0), which indicates miner stress and potentially undervalued prices.
- Active Addresses: There are ~800,000 to 1 million daily active addresses (down from peak hype), showing a cooling of network usage similar to late 2021.
- RSI (Relative Strength Index): An RSI of 35-40 suggests that the asset is approaching oversold territory.
The halving limits the daily issuance of new Bitcoin to 450 BTC. However, in this phase, sell-pressure from existing holders is currently outweighing the supply shock.
Pro Tip: If you compare the current chart to previous years, the early 2026 correction looks similar to the 2019 “mini-bear” market or the post-2021 cool-down.
Risks and Opportunities in Each Bitcoin Cycle Phase
Each phase offers different conditions for investors.
- Accumulation: This is generally considered a good time to buy. Investors who bought in 2023 saw significant returns by late 2025.
- Markup: The value of the asset grows. Investors often hold their positions, use ETFs, or look for high-growth opportunities in Spot Trading: SOL/USDT for exposure during this time.
- Distribution: This is when prices are highest. Some investors choose to take profits here (for example, at the $126,000 peak).
- Markdown: Prices correct and go down. This is the current environment. It resets the market for the next cycle but carries risks of further downside.
Highlight: A strategy like Dollar-Cost Averaging (buying small amounts regularly) is effective in the current $60,000-$70,000 range to manage volatility during this correction.
Bitcoin Cycles vs. Traditional Markets: Key Differences
Bitcoin behaves differently from the stock market.
| Feature | Bitcoin Cycles | Stock Market (S&P 500) |
| Cycle Length | ~4 years | Ongoing trends |
| Volatility | 60%+ annual | ~15% annual |
| Supply Mechanism | Fixed 21M cap, halvings | Unlimited shares |
| Key Driver | Halvings / Supply shock | Earnings reports |
| Historical Returns | High growth since 2010 | ~10% annual average |
Bitcoin’s cycle is driven by its code and fixed supply, whereas stocks are driven by company performance. Additionally, the crypto market operates 24/7, unlike traditional stock exchanges.
Conclusion
Bitcoin market cycles are predictable patterns caused by halving events. From $12 in 2012 to $126,000 in 2025, these cycles have consistently driven the market. By using tools like Glassnode and tracking the dates of the next halving (expected around 2028), investors can plan their strategies effectively.
Frequently Asked Questions (FAQ)
What triggers a new Bitcoin market cycle?
The primary trigger is the Bitcoin halving, which occurs every four years. This event cuts the supply of new Bitcoin in half, which often leads to a new cycle of price increases.
How long does a typical Bitcoin cycle last?
A cycle lasts approximately four years, from one halving to the next. The “bull” phase (when prices rise) typically lasts 12 to 18 months.
Can you predict the next Bitcoin bull market?
While exact predictions are impossible, metrics can identify trends. Currently, falling daily active addresses and ETF outflows suggest the market is in a corrective phase for 2026.
Should I invest based on Bitcoin cycle phases?
Many investors use cycle phases to guide their decisions. For example, buying during the accumulation phase (or during deep corrections like the current one) is a common strategy to prepare for the next markup phase.
How does the 2024 halving impact current Bitcoin prices?
The 2024 halving reduced the daily supply to 3.125 BTC per block. This supply shock helped drive the price to $126,000 in 2025, but macroeconomic factors are currently dominating price action in 2026.
The teňňe (plural: teňňe; symbol: t) is the official fractional monetary subunit of the Turkmenistan manat (TMT). Just as 1 US dollar equals 100 cents, 1 Turkmen manat equals 100 teňňe. Although small in value, the teňňe plays an essential role in Turkmenistan’s monetary structure and reflects the country’s political history, economic reforms, and national symbolism.
In this complete 2026 guide, we explore the history, denominations, design, economic relevance, and collector value of the teňňe in detail.
1. What Is the Teňňe? (Definition & Basics)
The teňňe is the coin-based subdivision of the Turkmenistan manat (TMT), the official currency of Turkmenistan, a Central Asian nation with a population of approximately 6 million people.
Key Facts at a Glance
-
Currency: Turkmenistan Manat (TMT)
-
Subunit: Teňňe
-
Conversion: 1 manat = 100 teňňe
-
Symbol: t
-
Form: Coins only (no teňňe banknotes)
-
Issuer: Central Bank of Turkmenistan
The name “teňňe” shares linguistic roots with other Central Asian currencies, including the Kazakh tenge, both derived from historical Turkic monetary terms.
2. History of the Teňňe
Post-Soviet Currency Reform (1993)
The teňňe was introduced on November 1, 1993, alongside the first Turkmen manat (TMM), replacing the Soviet ruble at a rate of:
1 manat = 500 rubles
This marked a critical step in Turkmenistan’s economic independence after the collapse of the Soviet Union.
Hyperinflation & Redenomination (2009)
During the 1990s, Turkmenistan experienced extreme hyperinflation, reaching thousands of percent annually.
To stabilize the economy, the government introduced a redenomination in 2009:
1 new manat (TMT) = 5,000 old manats (TMM)
Importantly, the teňňe remained the subdivision under the new currency system.
US Dollar Peg
Since January 1, 2015, the Turkmen manat has been pegged to the US dollar at:
1 USD = 3.50 TMT
From 2009 to 2015, the peg stood at 2.85 TMT per USD.
Although the official exchange rate is fixed, unofficial market rates have sometimes diverged due to currency controls and limited convertibility.
3. Teňňe Coin Denominations (2026 Circulation)
Teňňe exists exclusively in coin form. No banknotes are issued in teňňe denominations; paper currency begins at 1 manat.
Current Coins (Introduced 2009 Reform)
| Denomination | Material | Diameter | Weight | Edge | Year Issued |
|---|---|---|---|---|---|
| 1 teňňe | Nickel-plated steel | 16 mm | 2.4 g | Plain | 2009 |
| 2 teňňe | Nickel-plated steel | 18 mm | 3.2 g | Plain | 2009 |
| 5 teňňe | Nickel-plated steel | 20 mm | 4.0 g | Plain | 2009 |
| 10 teňňe | Brass | 22 mm | 5.0 g | Reeded | 2009 |
| 20 teňňe | Brass | 24 mm | 6.0 g | Reeded | 2009 |
| 50 teňňe | Brass | 26 mm | 7.0 g | Reeded | 2009 |
Circulation Trends
-
1, 2, and 5 teňňe coins are rarely used due to their low purchasing power.
-
10, 20, and 50 teňňe coins are more commonly circulated.
-
All coins are minted by the Royal Mint (United Kingdom).
Pre-2009 Coins
The 1993 series included cupronickel coins (1–50 teňňe), many featuring President Saparmurat Niyazov (Turkmenbashi). These coins were demonetized after 2009.
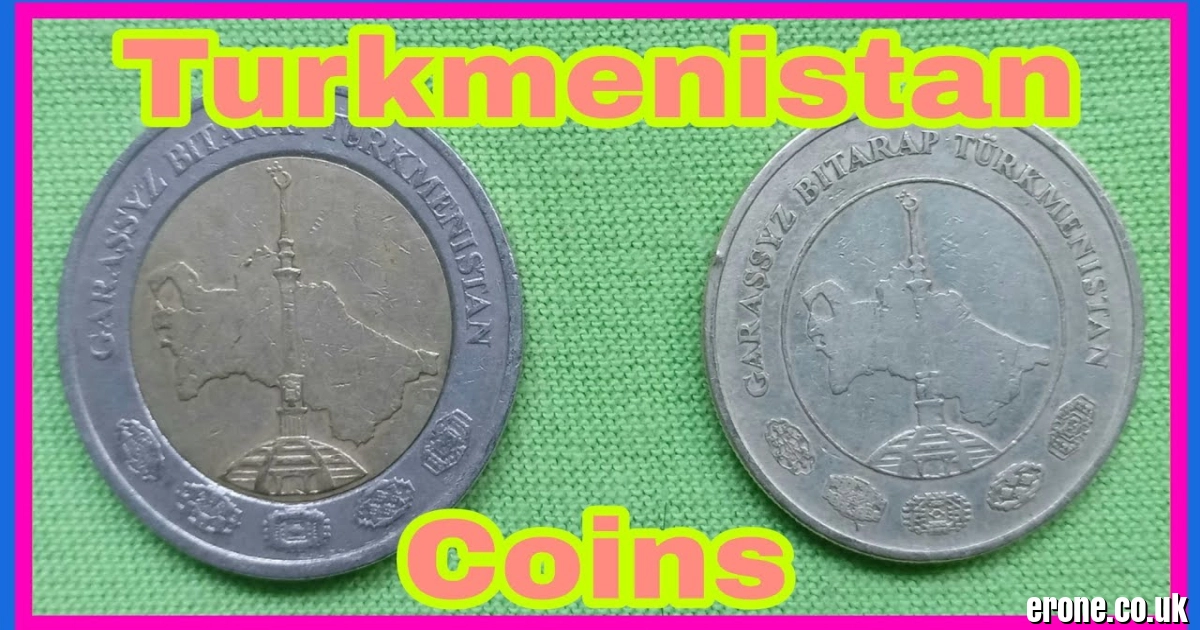
4. Design & Symbolism of Teňňe Coins
Turkmenistan’s currency design strongly reflects national identity and political philosophy.
Obverse Design
Modern coins feature:
-
A map of Turkmenistan
-
The Independence Monument in Ashgabat
-
Inscription:
“GARAŞSYZ BÝTARAP TÜRKMENISTAN”
(“Independent Neutral Turkmenistan”)
This slogan references Turkmenistan’s official policy of permanent neutrality, recognized by the United Nations in 1995.
Reverse Design
The reverse side displays:
-
The denomination (e.g., “10 TEŇŇE”)
-
Decorative elements like wheat ears, stars, and national motifs symbolizing prosperity and unity
Political Evolution in Design
-
Pre-2009: Featured President Niyazov’s portrait.
-
Post-2009: Shifted toward neutral state symbols under President Gurbanguly Berdimuhamedow.
-
Current designs emphasize national identity rather than individual leadership.
5. Relationship Between Teňňe & Manat Banknotes
While teňňe coins handle small-value transactions, manat banknotes serve larger purchases.
Current Manat Banknote Denominations
-
1 manat
-
5 manat
-
10 manat
-
20 manat
-
50 manat
-
100 manat
-
200 manat
-
Rare 500 manat
Polymer Banknotes (2025 Update)
In 2025, Turkmenistan introduced polymer versions of the 1, 5, 10, and 200 manat notes to commemorate the 30th anniversary of permanent neutrality.
These polymer notes offer:
-
Enhanced durability
-
Advanced security features
-
Improved resistance to counterfeiting
Banknotes often feature historical figures such as:
-
Oguz Khan
-
Magtymguly Pyragy
Alongside architectural landmarks like the Rukhiyet Palace.
6. Teňňe in the Modern Economy (2026 Perspective)
Economic Context
Turkmenistan’s economy relies heavily on:
-
Natural gas exports
-
State-controlled industries
-
Fixed exchange rate policy
Despite modernization efforts, cash transactions remain dominant, especially in smaller cities and rural areas.
Convertibility & Market Reality
Although officially pegged to the US dollar:
-
The manat (and therefore teňňe) has limited international convertibility.
-
A black market exchange rate has historically differed from the official rate.
This affects foreign exchange access but does not eliminate everyday domestic use of teňňe coins.
Collector Value
Teňňe coins attract attention from numismatists (coin collectors) worldwide.
-
Uncirculated examples typically sell for $1–$5 USD
-
Rare early 1993 coins can command higher prices
-
Available on platforms like Numista and eBay
Collectors often value the coins for their:
-
Unique national symbolism
-
Political transition history
-
Royal Mint production quality
Frequently Asked Questions (FAQs)
What does “teňňe” mean?
It refers to the subunit of the Turkmen manat, similar to “cents” in the US dollar system.
Is teňňe still used in 2026?
Yes, though lower denominations are less common in daily transactions.
Are there teňňe banknotes?
No. Teňňe exists only as coins.
Who mints teňňe coins?
The Royal Mint in the United Kingdom.
Can teňňe be exchanged outside Turkmenistan?
Generally no, as the manat has limited international convertibility.
Conclusion
The teňňe may be a small monetary unit, but it represents an important piece of Turkmenistan’s economic history and national identity. From its introduction in 1993 during post-Soviet reforms to its redesign in 2009 and continued use under a dollar peg, the teňňe reflects the country’s evolving financial system.
In 2026, it remains:
-
A functioning currency subdivision
-
A symbol of national neutrality
-
A collectible artifact for numismatists
Whether viewed from an economic, political, or historical perspective, the teňňe offers valuable insight into Central Asian monetary development in the post-Soviet era.
What Is 5StarsStocks .com? Platform Overview
If you’ve searched for AI stock recommendations or “best stock picks 2026,” chances are you’ve come across 5StarsStocks .com. Launched in 2023, this web-based investment research platform markets itself as a simplified, data-driven stock analysis tool built primarily for retail investors in the United States.
At its core, 5StarsStocks .com claims to democratize professional-grade investment insights. Instead of overwhelming users with dense financial statements and technical charts, the platform distills information into a proprietary five-star rating system. Think of it like Yelp—but for stocks. Instead of rating restaurants, it rates companies based on:
-
Fundamentals
-
Valuation metrics
-
Growth potential
-
Market sentiment
-
Risk assessment
The platform does not function as a brokerage. You cannot buy or sell stocks directly on the site. Instead, it acts as a research assistant, helping users identify potential opportunities before executing trades through their own brokers.
Launch Background and Mission
Founded in 2023, 5StarsStocks .com entered the market during a period when AI-driven investing tools were rapidly expanding. The rise of retail trading apps like Robinhood created a wave of self-directed investors looking for guidance. The platform positioned itself as a bridge between complex Wall Street analytics and everyday investors.
Its mission? To provide unbiased, accessible, and easy-to-understand stock insights without requiring advanced financial expertise.
Who Is It Designed For?
The platform primarily targets:
-
Beginner investors
-
Intermediate retail traders
-
Passive income seekers
-
Dividend-focused investors
It is not built for hedge funds or professional traders. Instead, it caters to individuals who want structured guidance without diving deep into spreadsheets.
How It Positions Itself in the US Investment Market
In the competitive US financial media space, 5StarsStocks .com emphasizes:
-
AI-powered stock ratings
-
Long-term growth investing
-
Sector-based analysis
-
Educational resources
Its positioning is clear: accessible insights without subscription complexity. Notably, the core content appears free, suggesting revenue may come from ads or affiliate partnerships.
Key Features and Tools of 5StarsStocks .com
The heart of 5StarsStocks .com lies in its structured features. Let’s break them down clearly.
AI-Powered Five-Star Rating System
The standout feature is the AI-driven 5-star rating system. Stocks are evaluated across five criteria:
| Factor | What It Measures |
|---|---|
| Fundamentals | Revenue, earnings, balance sheet strength |
| Valuation | P/E ratios, fair value metrics |
| Growth Catalysts | Industry trends, expansion opportunities |
| Market Sentiment | Analyst ratings, investor behavior |
| Risk Assessment | Volatility, debt levels, macro exposure |
Instead of pages of data, users see a visual rating—clean, simplified, and color-coded.
This makes it especially attractive for investors who want clarity without complexity.
Stock Recommendations and Sector Analysis
The platform regularly publishes curated lists such as:
-
Best Stocks for June 2024
-
AI sector picks
-
Renewable energy leaders
-
Dividend income stocks
-
Lithium and cannabis stocks
Example picks previously featured include:
-
Alphabet (GOOGL)
-
Spotify (SPOT)
-
Progressive (PGR)
-
Intuitive Surgical (ISRG)
-
Kraft Heinz (KHC)
These lists are accompanied by breakdowns of financial performance, competitive advantages, and potential risks.
Educational Resources and Blog Insights
Beyond stock picks, 5StarsStocks .com provides educational guides such as:
-
“From Savings to Investing: A 5-Step Transition Plan”
-
“2026 Forecast: How Demographic Shifts Will Shape Income Sectors”
-
Articles on the creator economy, 3D printing, and regulatory shifts
For beginners, this educational content is often the most valuable feature.
User Interface and Accessibility
The site is:
-
Web-based
-
No download required
-
Simple navigation
-
Beginner-friendly design
However, some users report data latency issues, particularly for real-time trading needs.
How 5StarsStocks .com Works – Step-by-Step Breakdown
Understanding how the platform operates helps determine its usefulness.
Stock Evaluation Process
The AI system processes:
-
Financial statements
-
Cash flow data
-
Competitive positioning
-
Macroeconomic trends
-
Insider activity
From this, it generates a star rating score.
While the algorithm details are not fully disclosed, the goal is to identify high-potential opportunities.
How Recommendations Are Presented
Users can:
-
Browse sector-based categories
-
Search for specific stocks
-
Review curated “5-star” picks
Each stock includes summaries of:
-
Growth drivers
-
Financial highlights
-
Risk considerations
-
Analyst sentiment
Risk Management and Strategy Guidance
The platform also promotes:
-
Portfolio diversification
-
Stop-loss strategies
-
Long-term income planning
Importantly, it includes a disclaimer stating it does not provide personalized financial advice.
Legitimacy, Trust Score & Real User Reviews
Now let’s address the question many investors ask:
Is 5StarsStocks .com legit?
ScamAdviser Rating and Transparency Concerns
ScamAdviser gives the platform a 66/100 trust score, indicating moderate credibility.
Concerns include:
-
Anonymous ownership
-
No SEC or FINRA registration
-
Limited transparency about AI methodology
However, there is no verified evidence of outright scams.
Accuracy Claims vs. Independent Testing
The platform reportedly claims around 70% accuracy in stock picks.
Independent evaluations suggest closer to 35% profitability in some sample tests.
That’s a significant discrepancy. It doesn’t make it fraudulent—but it does require caution.
Reddit & Community Feedback
User feedback is mixed:
Positive Reviews:
-
Easy to use
-
Helpful for beginners
-
Quick sector breakdowns
Negative Reviews:
-
SEO-heavy marketing
Most users agree: it works best as a supplemental research tool, not a standalone decision-maker.
Pros and Cons of 5StarsStocks .com
Advantages for US Retail Investors
-
Free access to stock ideas
-
Beginner-friendly interface
-
AI-driven screening
-
Focus on long-term strategies
-
Covers trending sectors like AI and renewables
Limitations and Potential Risks
-
Questionable accuracy claims
-
No regulatory oversight
-
Lack of transparency
-
Possible data delays
-
No direct trading integration
It’s important to remember: no stock platform guarantees profits.
Alternatives to 5StarsStocks .com & Final Verdict
If you’re considering alternatives in the US market, here are some comparisons:
| Platform | Cost | Strength |
|---|---|---|
| Yahoo Finance | Free | Broad data access |
| Seeking Alpha | Free/Paid | Community analysis |
| Motley Fool | Subscription | Proven stock advisory |
| Zacks | Subscription | Earnings-based rankings |
| TradingView | Free/Paid | Advanced charting |
Is 5StarsStocks .com Worth Using in 2026?
For beginners? Yes, as a starting point.
For advanced traders? Probably not sufficient alone.
The biggest strength is simplicity. The biggest weakness is transparency.
Final Recommendation
In 2026, 5StarsStocks .com stands as a solid entry-level stock research platform. It offers AI-driven insights, educational content, and sector-based recommendations that can help new investors build confidence.
However, due to moderate trust ratings and unclear methodology, it should be used cautiously. Always verify picks independently and consider consulting a licensed financial advisor.
Used wisely, it can be a helpful research assistant.
Used blindly, it can be risky.
FAQs
1. Is 5StarsStocks .com free to use?
Yes, core content appears free, though revenue may come from ads or affiliates.
2. Is 5StarsStocks.com regulated by the SEC?
No, it is not registered with the SEC or FINRA.
3. Does it guarantee profitable stock picks?
No platform can guarantee profits.
4. Is it suitable for beginners?
Yes, its simplified rating system is beginner-friendly.
5. Should I rely solely on 5StarsStocks.com?
No. Always cross-check with other reputable research tools.
Crypto
DL Mining Launches 2026 Smart Cloud Contracts — Zero Setup, Daily BitcoinÐ Rewards Now Live!”

A New Era of Effortless Crypto Mining Begins: Earn Daily Profits with AI-Powered Contracts and Zero Hardware Hassle
Want to mine Bitcoin easily in 2026? Now, there is no need to buy expensive mining machines or bear high electricity bills. DL Mining’s AI smart cloud mining contract allows you to easily participate in Bitcoin mining, with stable daily income and no trouble for hardware maintenance!
✅ AI optimizes computing power allocation-maximize your mining income
✅ Zero upfront investment-no need to buy equipment, one-click to start mining
✅ Daily automatic settlement-transparent income, cash withdrawal at any time
✅ Safe and reliable-professional team operation, stable and efficient
Say goodbye to the high cost and high risk of traditional mining. In 2026, DL Mining will let you get Bitcoin in a smarter way! 🚀
Explore DL Mining’s high-yield mining contracts
DL Mining contracts focus on efficiency – short term, fast turnaround and full refund. Here are some of the most popular contract options for 2026:
This chart illustrates the potential profits you can make.
Why is DL Mining the best cloud mining platform in 2026?
Three core advantages: high performance, complete transparency, and minimal operation. The platform automatically handles computing power allocation and daily settlement, and you can passively earn cryptocurrencies such as BTC without any technical threshold.
✨ Core advantages
- Sign up to get $20 and Sign in daily to get $1
- Mobile terminal optimization – Android/iOS management at any time
- AI intelligent tuning – maximize profits in real time
- Military-grade security – cold storage + 2FA + smart contract audit
- Compliance operation – global encryption qualification certification
- Multi-currency support – BTC/ETH/DOGE/LTC flexible switching
Use technology to simplify mining and make profits smarter.
A smarter way to earn crypto in 2026
DL Mining uses AI technology to simplify mining, making earnings simpler and more stable. Suitable for:
✓ Investors seeking short-term returns
✓ Users who want passive income
✓ Novices experience zero-cost mining
Say goodbye to complex hardware, a new era of smart mining.
How to start mining with DL Mining
Step 1: Sign up: create an account and get $20.
Step 2: Activate your $20 investment and buy a free contract to get $1 profit every day.
Step 3: Earn and withdraw daily Track your profits in real time. Withdraw or reinvest at any time to scale up.
Conclusion: DL Mining offers simple, fast and real returns
DL Mining ranks among the best Bitcoin cloud mining solutions in 2026 with its AI-optimized mining scheme, $15 free entry price, and mobile platform. It meets all the needs of modern investors: speed, security, sustainability, and profit.
Start mining smarter and start making money faster.
For more details, visit www.dlmining.net and claim your $15 trial contract now. Download APP.


Veronica Mars Movie (2014): The Complete Guide, Plot, Cast, Kickstarter Record & Legacy

Eron Johnson: Biography, Net Worth, Antiques Empire and Everything You Need to Know
