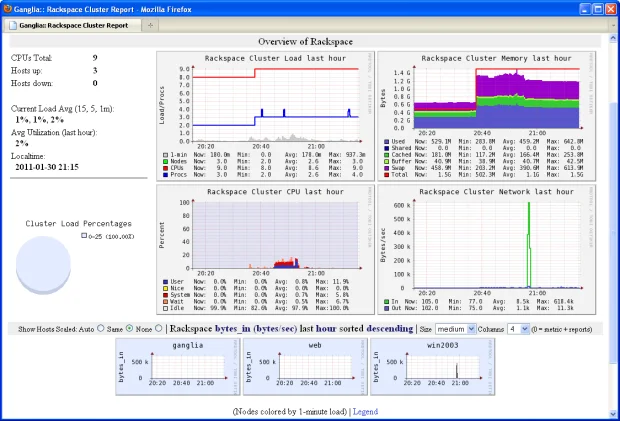
In modern IT infrastructure, monitoring system performance in real time is not optional—it is essential. As environments grow more complex with distributed systems, clusters, and cloud-based workloads, tools that provide accurate, lightweight, and scalable monitoring become invaluable. One such tool is gmetric.
If you’ve come across the term gmetric while working with Linux servers, cluster monitoring, or Ganglia, this article provides a full, informative, SEO-optimized explanation designed to rank highly on Google. Every section highlights important terms in bold and explains the concept in a clear, human-friendly way.
What Is gmetric? An Overview
gmetric is a command-line utility used to send custom metrics to a Ganglia monitoring system. It is part of the Ganglia Monitoring Toolkit, a widely used open-source system designed for monitoring clusters, grids, and large-scale distributed systems.
Unlike passive monitoring tools that only collect predefined system statistics, gmetric allows users to inject their own metrics into Ganglia. These metrics can represent:
-
Application performance data
-
Business logic indicators
-
Custom system measurements
In simple terms, gmetric acts as a bridge between custom data and Ganglia’s monitoring engine. It enables administrators and developers to monitor exactly what matters to them, not just CPU or memory usage.
Because of its lightweight design, gmetric is commonly used in:
-
High-performance computing (HPC) clusters
-
Data centers
-
Cloud and hybrid infrastructures
How gmetric Works in Ganglia Monitoring
To understand gmetric, it helps to know how it fits into the Ganglia architecture.
Ganglia consists mainly of:
-
gmond (Ganglia Monitoring Daemon)
-
gmetad (Ganglia Meta Daemon)
-
gmetric (Custom metric sender)
gmetric sends metric data to gmond, which then broadcasts or forwards the data across the cluster. From there, gmetad collects and stores the metrics, making them available for visualization through Ganglia’s web interface.
Key Characteristics of gmetric
-
Uses UDP or multicast communication
-
Minimal performance overhead
-
Works without modifying existing monitoring agents
-
Supports both temporary and persistent metrics
This architecture allows real-time visibility into both system-level and application-specific data.
Why gmetric Is Important for System Administrators
For system administrators, gmetric provides flexibility that standard monitoring tools cannot. While built-in metrics show hardware and OS performance, they often fail to reflect application behavior or business logic.
With gmetric, administrators can monitor:
-
Number of active users
-
Queue lengths
-
API response times
-
Custom error counters
This capability transforms Ganglia from a system monitor into a full observability platform.
Another major advantage is low resource consumption. Because gmetric is lightweight, it can be used in large clusters without impacting performance, making it ideal for production environments.
In short, gmetric empowers administrators to see beyond the surface and monitor what truly affects system health.
Common Use Cases of gmetric
gmetric is highly versatile, which is why it is widely adopted across different industries and environments.
Popular Use Cases Include
-
Monitoring application-specific metrics in distributed systems
-
Tracking batch job progress in HPC clusters
-
Measuring custom KPIs in data pipelines
-
Exposing performance metrics for microservices
For example, instead of only tracking CPU usage, a developer can use gmetric to report “transactions processed per minute”, giving immediate insight into application performance.
Because metrics sent via gmetric can be visualized alongside standard metrics, correlating system performance with application behavior becomes much easier.
Advantages and Limitations of gmetric
Like any tool, gmetric has strengths and limitations.
Advantages
-
Highly customizable metrics
-
Low overhead and fast communication
-
Seamless integration with Ganglia
-
Open-source and widely supported
Limitations
-
Requires Ganglia infrastructure
-
Limited native security features
-
Less modern compared to newer observability tools
Despite these limitations, gmetric remains relevant due to its simplicity, reliability, and efficiency—especially in environments where Ganglia is already deployed.
gmetric in Modern Monitoring Environments
Although newer monitoring platforms like Prometheus and Datadog have gained popularity, gmetric still plays an important role in many organizations.
It is particularly useful in:
-
Legacy systems
-
Academic and research clusters
-
Cost-sensitive environments
Many teams continue using gmetric because it “just works”. It does not require complex configuration, heavy agents, or expensive licensing.
In environments where stability and predictability matter more than flashy features, gmetric remains a trusted monitoring companion.
Conclusion
gmetric is a powerful yet lightweight tool for sending custom metrics to Ganglia, enabling deep insight into both system and application performance. Its ability to extend monitoring beyond default metrics makes it invaluable for administrators managing clusters, distributed systems, and performance-critical environments.
While newer tools exist, gmetric’s simplicity, efficiency, and reliability ensure its continued relevance in many infrastructures. If you are using Ganglia—or planning to—gmetric is an essential component worth mastering.
Frequently Asked Questions (FAQs)
1. What does gmetric do?
gmetric sends custom metrics to Ganglia, allowing monitoring of user-defined data.
2. Is gmetric part of Ganglia?
Yes, gmetric is a core utility within the Ganglia Monitoring Toolkit.
3. Can gmetric monitor application metrics?
Absolutely. Custom application metrics are one of its main use cases.
4. Is gmetric still used today?
Yes. It is widely used in clusters, research environments, and legacy systems.
5. Is gmetric open source?
Yes. gmetric is open-source and freely available.


